
If you’ve followed me for a while, you probably know I started my career as a QA engineer before transitioning into the world of data analytics. I didn’t go to school for it, didn’t have a mentor, and didn’t land in a formal training program. Everything I know today—from SQL to modeling to storytelling with data—is self-taught. And believe me, it’s been a journey of trial, error, learning, and re-learning.
The Dilemma That Changed My Career
A few years ago, I started thinking about switching organizations. Like many people in fast-evolving tech roles, I faced a surprisingly difficult question:
What role am I actually doing? Which roles should I apply for?
On paper, I was a Data Analyst. But in reality, my role straddled several functions: writing SQL pipelines, building dashboards, defining KPIs, and digging into product analytics. I wasn’t sure whether I should be applying for Analyst roles, BI roles, or something entirely different.
To make things worse, back then, job titles were vague, and job descriptions were bloated with buzzwords. You’d find a posting titled “Data Analyst” that listed requirements like:
- Build ML pipelines
- Write complex ETL scripts
- Maintain data lakes
- Create dashboards
- Present executive-level insights
- And oh, by the way, be great at stakeholder management
It was overwhelming and confusing. And I know I’m not alone in this.
Fast forward to today: thankfully, things are evolving. There’s still overlap between roles, but organizations have started to define them more clearly. In this article, I want to break down the real differences between data roles, through the lens of a real-world example.
A Real-World Scenario: Meet Quikee
Let’s imagine a fictional quick-commerce startup called Quikee, launching across multiple Indian cities. Their value proposition? Deliver groceries and essentials within 10 minutes.
Customers place orders through the app or website. Behind the scenes, there are micro-warehouses (also called “dark stores”) across cities, and a fleet of delivery partners who make those lightning-fast deliveries.
Now, let’s walk through the data needs of this company—from the moment an order is placed, to the dashboards executives use in their Monday morning meetings.
Step 1: Capturing and Storing Raw Data
The moment a customer places an order, transactional data is generated:
- Timestamps
- Order ID
- Items ordered
- Price
- Discount codes
- Customer location
- Payment method
- Assigned delivery partner
Let’s assume Quikee uses Amazon Kinesis to stream this data in real time to an S3 data lake. That stream is high-volume, time-sensitive, and crucial for business tracking.
But here’s the catch: raw data is messy. You can’t use it directly for decision-making.
So what happens next?
Step 2: Building Data Pipelines
Enter the Data Engineers.
They are responsible for:
- Ingesting real-time data
- Validating schema consistency
- Handling failures and retries
- Writing pipelines to move data from S3 into a data warehouse (say, Snowflake or Redshift)
This is where ETL (Extract, Transform, Load) or ELT pipelines come into play. Data engineers clean, format, and structure the data to make it queryable.
For example, an order table might get split into:
- Orders → One row per order
- Order_Items → One row per item in an order
- Payments → One row per payment attempt
At this stage, raw logs are turned into structured tables that analysts can work with.
Step 3: Dimensional Modeling & OLAP
As leadership starts asking strategic questions like:
- “Which city brings in the most revenue?”
- “Which store is underperforming?”
- “What’s our average delivery time by zone?”
…it becomes clear that querying transactional data directly won’t scale.
That’s where dimensional modeling comes in.
Instead of flat, raw tables, data is structured into Fact and Dimension Tables.
 Fact Tables
- Large, quantitative data tables which contain foreign keys along with measures and metrics (Well, most of the time. There are factless fact tables as well which do not have any measures).
- Examples:
fact_orders,fact_payments,fact_deliveries - Contain metrics like revenue, order count, delivery time
 Dimension Tables
- Smaller, descriptive tables that help understand the data in a fact table
- Examples:
dim_store,dim_product,dim_customer,dim_delivery_agent - Help filter, group, and join facts for deeper insights
This structure enables OLAP—fast, analytical querying across multiple dimensions. For example, you can now run queries like:
“Show me average delivery time by store and hour of day, over the last 7 days.”
This step is done by Data Engineers at most of the organisations but I did build few Dim and Fact tables when I was working as a Business Intelligence Engineer at Amazon.
Step 4: Defining KPIs and Metrics
This is where Analytics Engineers (or BI Engineers) shine.
They sit between the technical data layer and business users. Their responsibilities often include:
- Defining KPIs (e.g., churn rate, repeat purchase %, time-to-fulfillment)
- Writing logic for complex metrics (e.g., cohort retention, active users)
- Creating semantic models or metrics layers in tools like dbt or Looker
- Ensuring consistent definitions across the company
For example, at Amazon, our team didn’t query raw data to calculate revenue every time. Instead, we created pre-aggregated fact tables at daily, weekly, and monthly grains. That way, dashboards loaded faster, and metrics stayed consistent across teams.
Analytics Engineers act as translators between engineering and the business—defining what we measure and how we measure it.
Step 5: Analysis, Reporting & Storytelling
Now comes the role of the Data Analyst.
Armed with clean, modeled data, they focus on answering real business questions like:
- “Why did retention drop in Bangalore last month?”
- “Which coupon codes drive the most new users?”
- “What are the top products reordered in the first 30 days?”
They build dashboards in tools like Tableau, Power BI, or Looker. They run ad-hoc SQL queries. They dive into A/B test results, user behavior trends, and campaign effectiveness.
But above all, they tell stories with data—making complex numbers understandable and actionable for stakeholders.
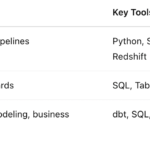
Who’s Who?

TL;DR: Where Do You Fit?
Here’s how I think about it:
- Love building robust pipelines and solving scalability problems? → You’re a Data Engineer
- Love defining business metrics and organizing complex datasets? → You’re an Analytics Engineer
- Love uncovering insights and storytelling with data? → You’re a Data Analyst
Of course, real-world roles often blend these. Especially at smaller companies, you may wear multiple hats. And that’s okay.
The key is not the title—but where you add the most value and what energizes you.
Final Thoughts
It took me a long time to understand what I actually do—not just what my job title says. And if you’ve ever felt that confusion, you’re not alone.
Today, I can clearly say I operate at the intersection of data modeling, business logic, and storytelling—a sweet spot between analytics and engineering. And I’ve learned that the ability to connect the dots is more important than fitting into a perfect box.
If you’ve walked a similar path—or wear multiple hats in your role—I’d love to hear your story.
Drop a comment  or share this with someone figuring it out too.
The post Data Analyst or Data Engineer or Analytics Engineer or BI Engineer ? appeared first on Towards Data Science.
What’s the real difference?
The post Data Analyst or Data Engineer or Analytics Engineer or BI Engineer ? appeared first on Towards Data Science. Data Science, Analytics Engineering, Business Intelligence, Data Analyst, Data Engineering, Data Roles Towards Data ScienceRead More

 Add to favorites
0 Comments